Heraldic crests were created to represent families and soldiers at a glance in medieval Europe. They had to be visually striking, but also communicate the history, personality, and intentions of those they represented. Every element of a heraldic crest means something and was chosen with care.
Similarly, every piece of a data story should be chosen intentionally. We can look back on the elements of heraldic crests as a reminder of what elements we should pay attention to when we assemble a data visuaization or data journalism project. I've distilled four primary lessons that we can takeaway from this historical practice, each detailed in this project.
Scroll through the different aspects of heraldic crests to learn how each can help us build a strong and thoughtful data story. You can also use the links below to jump to a specific element.
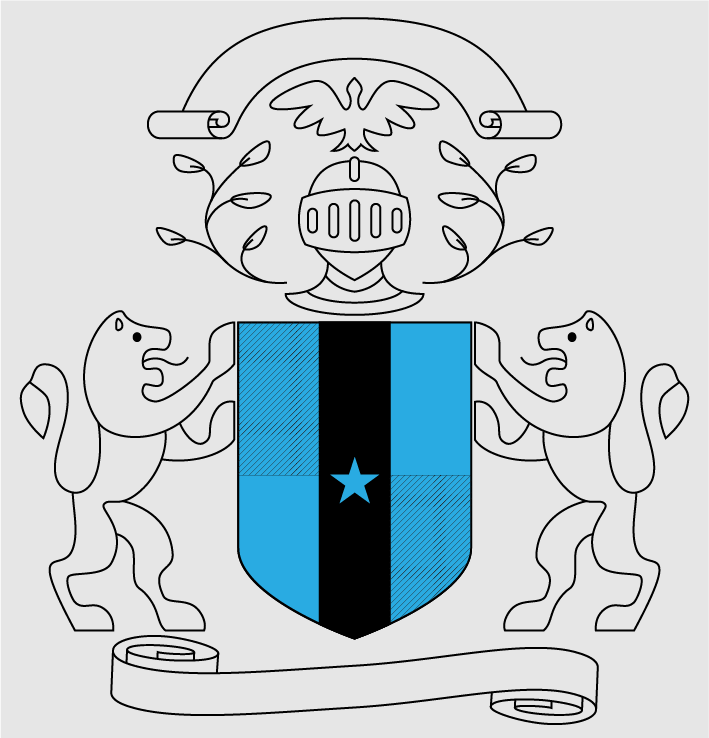
I created the heraldic crest below as an example of what a crest could look like. This crest is not imbued with any specific meaning, nor does it represent a particular family or historic individual, it is simply a learning tool for the purposes of this project.
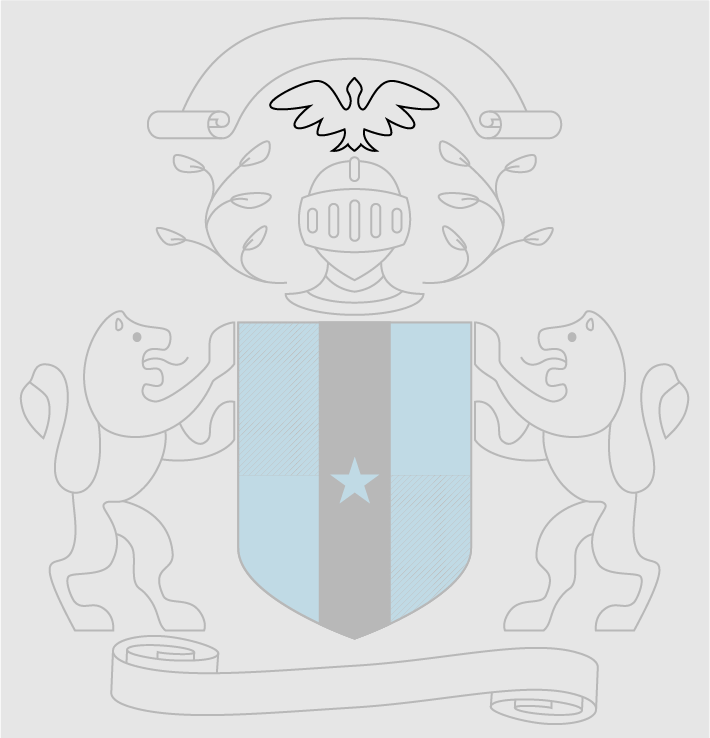
At the top of a heraldic crest is a slogan, traditionally inscribed with the battle cry of the soldier it represented. In data stories, this can be a reminder to include a call to action for the audience. Let them know whether your story should prompt them to make a change, go to an event, or support a cause. If and when a data story has a call to action, it should be stated early and emphasized throughout the project.
The crest is a representation of the individual or family’s greatest heraldic achievement. It proves their worthiness to be represented and noticed. Similarly, data stories need to cite their sources of information and explain why those sources are reputable. The crest can also represent your journalistic credentials—the organization you work for, the training you’ve done, the past impact you’ve had, and other aspects of your qualifications that make you a trustworthy data storyteller.
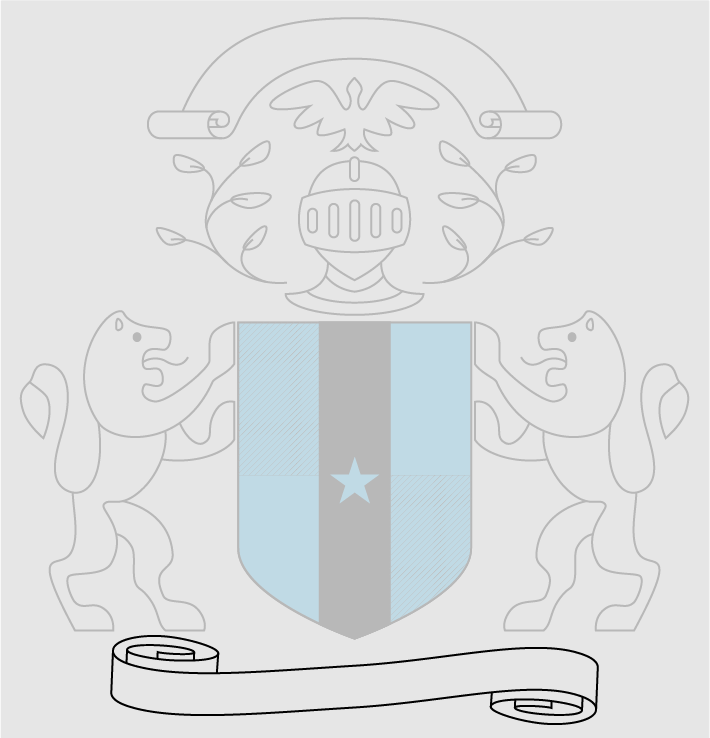
Marking the bottom of the heraldic crest is the motto, which sets the ultimate goal or intention of the person represented by the crest. This is another reminder to tell the audience what you want them to take away from your story. Is there a particular trend or piece of information that they should remember? When they tell their friends about your story, what should the one-line version of it be? Make your intention clear to the audience in the title so they know your aim from the outset.
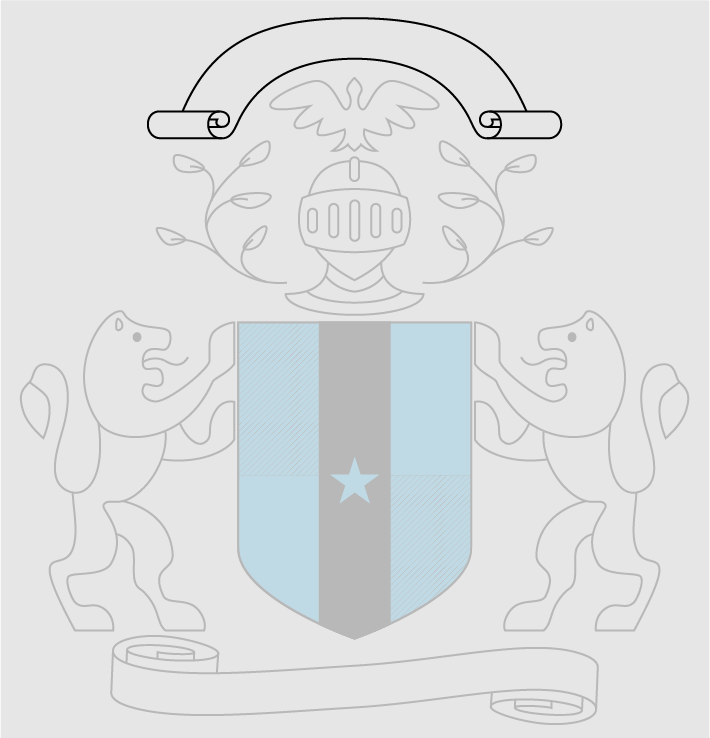
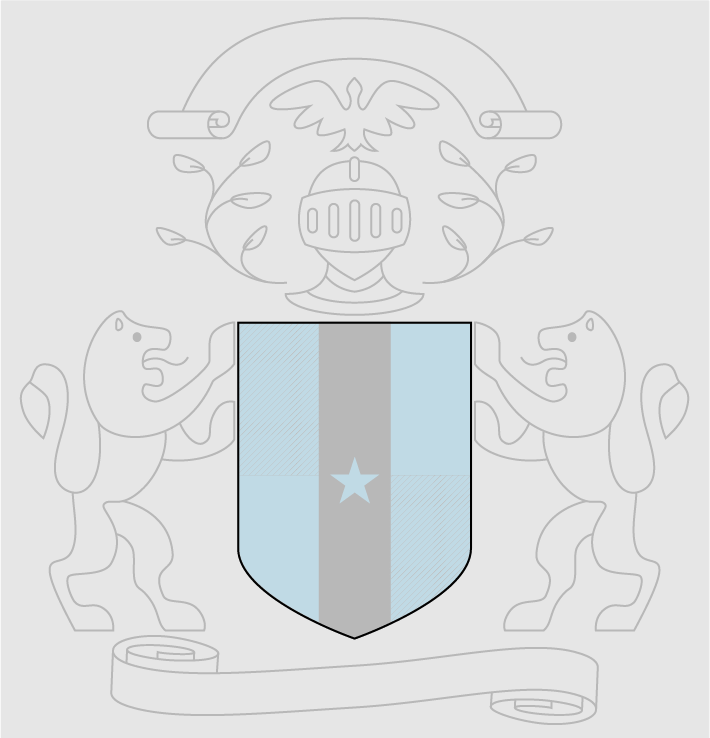
The shield is the form or silhouette of the crest. There are many shapes to choose from and they each have a different meaning. In a data story, the shield is your visualization format and story organization. It tells the audience what kind of information to expect as they engage with your story. It can help if you choose a format that is familiar to your audience so they can focus on the content of your data story as opposed to learning a new type of visualization; however, there are times when a new format reveals something important about the data or when the cognitive load of a new format helps the audience engage more deeply with the story. Be thoughtful about the intention behind the shield you choose, as it impacts the rest of the story.
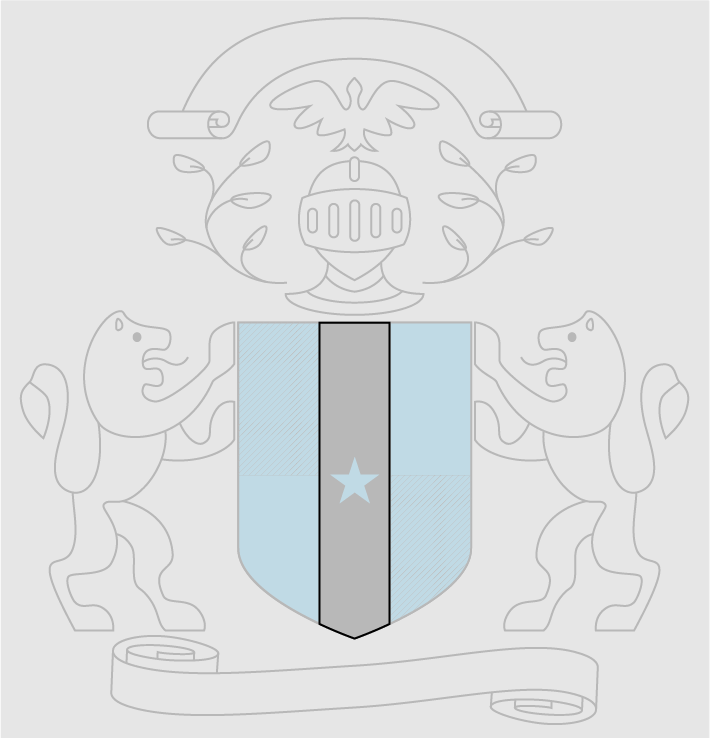
Ordinaries are the bold, geometric shapes that decorate the shield. These add to the recognizability of the crest as a whole and differentiate it from others of the same shape. The ordinaries on a shield remind us to be bold in our journalistic and design choices. Try new avenues for finding data, experiment with new technologies, and look for sources in unlikely places. As you make these choices, also make them explicit to your audience. Providing clear and transparent information about your process and methods helps build trust.
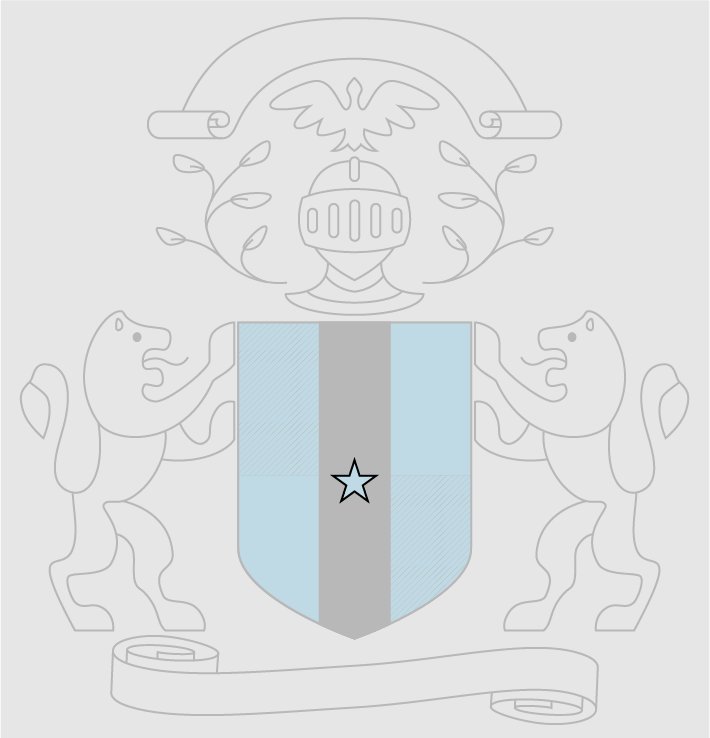
Most heraldic crests have one or more charges on their shield. Charges are small embellishments on the shield that, along with the ordinary, help make the crest unique to the person or family it represents. In a data story, charges are analogous to the notes, unique design features, or other details that help highlight your insights. Like charges, these small elements can make a big impact and help your story stand out to the audience.
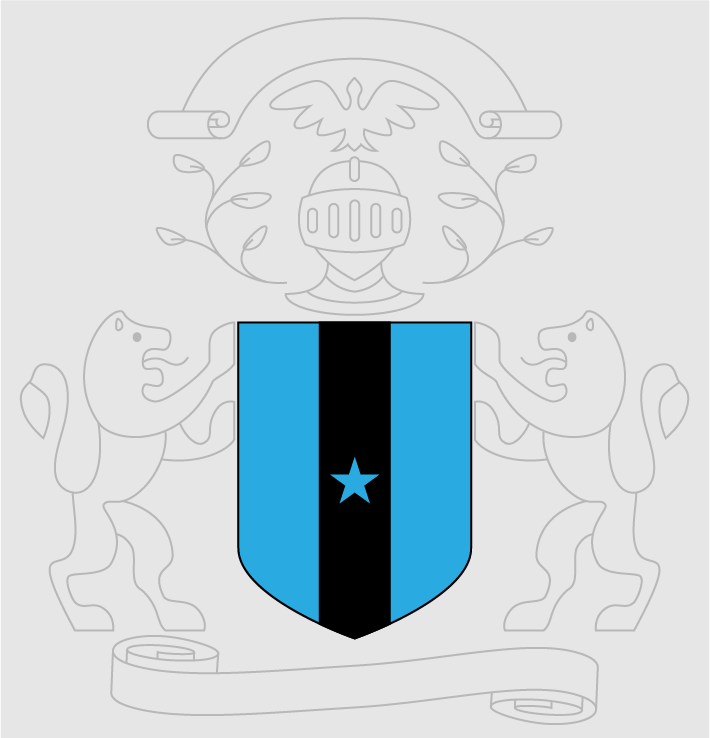
During medieval times, the designers of heraldic crests typically used more limited color palettes, choosing one to three distinctive colors to emphasize certain parts of the crest and symbolize the values or history of those it represented. Similarly, colors in data stories should be considered carefully and leveraged to emphasize where you want the audience to pay attention. Colors in data stores can also be symbolic, using the audience’s preexisting associations with certain colors to help them understand your insights.
Textures on the shields of heraldic crests—like ordinaries and charges—were used to make the shield unique. However, texture plays a much more important role in a data story. Including textures in a data visualization can help make that data visualization more accessible for those with any form of color blindness. My differentiating groups through both texture and color, you build in redundancies for the audience, allowing them to have multiple ways to distinguish differences. Texture can also add depth to the visual elements of a data story, communicating a specific tone or feeling.
The helm is one of the final embellishments that helps flesh out the heraldic crest. It adds flair and a sense of completion. Data stories find their helm in the editors and mentors who help finalize the project before publication. Crediting your editors in a data story helps maintain transparency into the complex story creation process for the audience and acknowledges who helped bring the work into its final form.
There can be a few or many insignia embellishing the background of a heraldic crest. They are most often positioned near the top of the crest by the helm and slogan, but can also be found at the bottom near the motto. At times, audiences might glaze over the insignia, but they are essential to the overall look and function of the heraldic crest. Similarly, audiences might not always pay attention to the exact tools or tech stack of a data story, but the story would not be the same without those tools. Be sure to give audiences the ability to understand your data toolkit and be prepared to talk about the backend of your project.
Arguably one of the more noticeable elements of a heraldic crest, the supporters are humanoid or animal figures on either side of the shield that appear to hold the shield in place. These supporters on heraldic crests represent supporters in real life: the collaborators and colleagues who worked on the data story with you. Give credit where credit is due and ensure your entire team is acknowledged for their work to make the data story possible.
This is a fun creative project that I executed on my own, but I do other (very serious) data journalism work, too! I'm currently on the hunt for both freelance and full-time work, so if you or anyone you know is hiring, please connect with me on LinkedIn or email me at go2emiliaruz@gmail.com. You can also check out my portfolio and resume for more information.